Analysis:
The analyses shown below cover the design of the drivetrain and steering systems of the RC Baja car. These analyses cover things from the diameter of the driveshaft to the length of the tie rods and the gear ratio needed to ensure the RC Baja car is as efficient as possible. These analyses assist in meeting certain performance goals for the RC Baja car. These requirements include the RC Baja car must reach speeds of at least 20 MPH, turn a 60-degree corner at least 2 MPH without yawing 10 degrees, the drive train must weigh less than 2 lbs, the battery must provide maximum power to the motor for 3 minutes, and the steering must have a minimum deflection of 0.125 in when dropped from 1.5 ft.

Analysis 1
The actual power and amperage of the motor was found in Analysis 1. Analysis 1 was needed to assist in the overall design and layout of the drivetrain system. To get these values, the equation Pactual= ηmotor x Pmotor to get the actual power of the motor. The Ohm’s equation I= P/V will be used to calculate the current that flows through the system at full power. Knowing the value of the actual power will be used when designing the driveshaft with regard to torque and the amperage will be a value that can be used when developing the necessary electronics. This analysis will not be shown physically in the final product but they will be used to dictate the design of certain aspects of the RC Baja car. It will be documented in the engineering notebook for this project for future reference. This analysis leads to the fulfillment of achieving a top speed of 20 MPH.
Figure 1- Actual Power and Amperage Calculation
Analysis 2
The torque of the motor was calculated in Analysis 2. Analysis 2 is needed do determine the dimensions of the driveshaft to ensure the most efficient design. To get the torque, the actual power is divided by the RPM of the motor. A safety factor of four is then applied to ensure a safe by effective design. This value will be documented in analysis 3 and the driveshaft part drawing. This analysis leads to the fulfillment of achieving a top speed of 20 MPH.

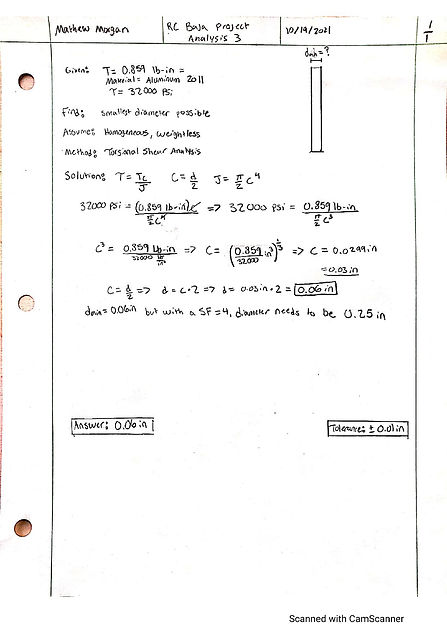
Figure 2- Torque Provided by the Motor
Analysis 3
The minimum diameter of the driveshaft was found in Analysis 3. Analysis 3 was used to determine the most efficient design, to help achieve the top speed of 20 MPH, and achieve the weight of 2lbs or less for the entire drivetrain system. To get the minimum diameter, shear torque analysis was used by taking the shear strength of the chosen material which is 2011-T3 Aluminum and setting it equal to the torque multiplied by c which is the radius. This product is then divided by J which is pi/2 (c)^4. After the equation is solved for and c is found, it is multiplied by 2 to get the minimum diameter. A safety factor of 4 is then applied to get the final diameter of the driveshaft. This value is documented in Drawing MDM_20-002 as it is the diameter of the driveshaft.
Figure 3- Minimum Diameter for Driveshaft
Analysis 4
The individual gear ratios for the driveshaft and transmission were found in Analysis 4. The manufacturer of the motor recommends a gear ratio of 8:1 for best performance. Analysis 4 was used to determine the most efficient design and to achieve a top speed of 20 MPH. To get the gear ratios, the top speed of 20 MPH is converted into in/min. The ideal RPM is then calculated. The current train value is then calculated by dividing the maximum RPM of the motor by the ideal RPM. By looking at gearing charts, a drivetrain ratio is then picked and calculated by dividing the bigger gear by the smaller gear. This value is then plugged into the train value equation which is TV=VR1 x VR2 which gives the VR2 value. This VR2 value is then rounded to the nearest gear ratio value and then appropriate gears are then found. The VR1 value is 2.667 and VR2 is 3 which equates to an 8:1 overall ratio. The transmission gears (the 2.66 ratio) are shown in drawings MDM_55-001 and MDM_55-002.
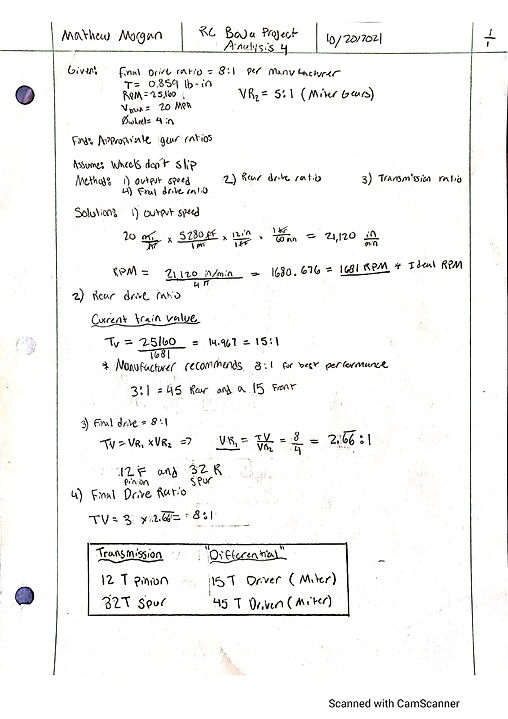

Figure 4- Drivetrain Analysis
Analysis 5
The minimum diameter for the rear axle was solved for in Analysis 5. Analysis 5 was used to determine the most efficient design, to achieve a max speed of 20 MPH, and to make the drivetrain system less than 2 pounds. To get the minimum diameter, shear torque analysis was used by taking the shear strength of the chosen material which is 2011-T3 Aluminum and setting it equal to the torque multiplied by c which is the radius. This product is then divided by J which is pi/2 (c)^4. After the equation is solved for and c is found, it is multiplied by 2 to get the minimum diameter. A safety factor of 3 is then applied and then rounded to the nearest practical dimension. The made the rear axle diameter 0.5”. This value will be documented as the diameter of the axle located in Drawing MDM_20-003.
Figure 5- Minimum Diameter of Rear Axle
Analysis 6
The deflection of the rear axle after the RC car is dropped from 1.5 ft is what is covered in Analysis 6. Analysis 6 was used to ensure that the RC car would take a 60-degree corner without yawing more than 10 degrees and to ensure the most efficient design. The axle is analyzed in half assuming that it is a fixed cantilever beam using the deflection equation -PL3/3EI and conservation of energy to determine the P to use in the previous deflection equation. It is assumed the fixed end is caused by the differential case placed at the center of the axle. First, PE=KE was used to determine the velocity of the rc car from 1.5 feet. The acceleration is then found using the equation Vf2 = Vo2 + 2a(s) where Vo is zero. The equation is rearranged to solve for acceleration. F = ma is then used to determine the force of the impact of the car. After this is found, the deflection was found using the previously stated deflection equation. This analysis will be used in drawing MDM_20-003 to confirm that the design of the rear axle is efficient.

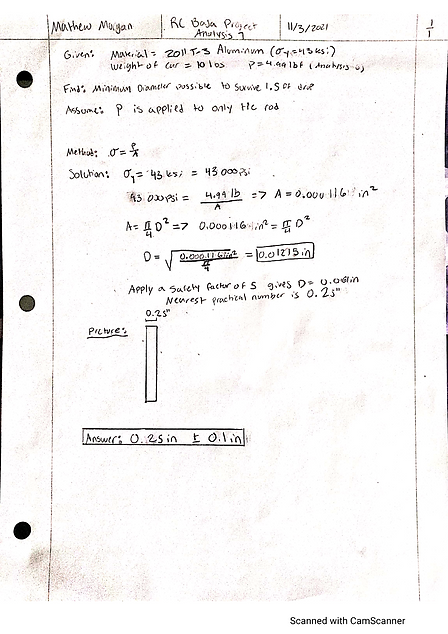
Figure 6- Rear Axle Deflection
Analysis 7
The minimum diameter for the tie rods was solved for in Analysis 7. Analysis 7 was used to determine the most efficient design, and to make the steering system less than 1.5 pounds. To get the minimum diameter, σ = P/A was used by taking the yield strength of the chosen material which is 2011 T-3 Aluminum and setting it equal to the force of 4.99 pounds that was found in Analysis 6 and divided by A which is the unknown. Once A is found, then it set equal to area of a circle which is (π/4) D2. Using the previously stated equation, the smallest diameter is found. A safety factor of 5 is then applied and then rounded to the nearest practical dimension. This made the tie rod diameter 0.125”. This value will be documented as the diameter of the tie rod located in Drawing MDM_20-004.
Figure 7- Tie Rod Minimum Diameter
Analysis 8
The length of the tie rods was solved for in Analysis 8. Analysis 8 was used to determine the most efficient design, and to make the drivetrain system less than 2 pounds. The length of the tie rod was found by taking half of the width of the chassis which is 4.5 inches and the length of the A arm which is 4 inches. Th A-Arm is assumed to sit at a 30-degree angle and will therefore have to use trigonometry to solve for the additional length. The half of the chassis width is used as the adjacent side and rearranging cos (30) = 4.5/h, the equation h = 4.5 in/cos (30) is found. This gives the value of 5.2 inches which is then added to the known length of the A-Arm which is 4 inches. This gives a total length 9.2 inches. This value will be documented as the length of the tie rod located in Drawing MDM_20-004.


Figure 8- Tie Rod Length
Analysis 9
The buckling of the tie rod after the RC car endures a side load is what is covered in Analysis 9. Analysis 9 was used to ensure that the tie rods would be able to endure all possible loads during the operation of the RC car. It also is used to ensure the weight of the steering system is under 1.5 lbs. Using column analysis, the smallest radius of gyration, the slenderness ratio, and the column constant is found. After finding these three values, it is determined to use Euler’s formula to solve for Pcr. Using the equation π2EA/(SR)2, the value for Pcr is found to be 227lbs. A stress check is then determined to see if Pcr is less than σy. It is found that the stress for this load is less than the yield of the 2011 T-3 Aluminum. This analysis will be used in drawing MDM_20-004 to confirm that the design of the tie rod is efficient.
Figure 9- Tie Rod Buckling
Analysis 10
Analysis 10 was used to determine if a 0.125” 2011 T-3 cold drawn aluminum steering pin would be able to support a load of 15 lbs. This analysis was used to determine the most efficient design as it will be strong and light weight and to ensure the weight of the steering system is less than 1.5 pounds. This analysis utilizes double shear analysis. The equation for σavg = F/2πr2 with F being assumed to be 15 lbs. and r is 0.0625”. Using the previous values and equation, the σavg is found to be 611 psi which is drastically less than the max shear stress of 32000 psi for the material. This value will be documented as the radius of the pin located in Drawing MDM_20-005.


Figure 10- Steering Pin Shear Analysis
Analysis 11
The buckling of the top control arm after the RC car endures a side load is what is covered in Analysis 11. Analysis 11 was used to ensure that the control arm would be able to endure all possible loads during the operation of the RC car. It also is used to ensure the weight of the steering system is under 1.5 lbs. Using column analysis, the smallest radius of gyration, the slenderness ratio, and the column constant is found. After finding these three values, it is determined to use Euler’s formula to solve for Pcr. Using the equation π2EA/(SR)2, the value for Pcr is found to be 228lbs. A stress check is then determined to see if Pcr is less than σy. It is found that the stress for this load is less than the yield of the 2011 T-3 Aluminum. This analysis will be used in drawing MDM_20-006 to confirm that the design of the control arm is efficient.
Figure 11- Control Arm Buckling
Analysis 12
Analysis 12 was used to determine the minimum diameter of the kingpin for the steering that would be able to support a load of 15 lbs. The material for this kingpin is 2011 T-3 aluminum. This analysis was used to determine the most efficient design as it will be strong and light weight and to ensure the weight of the steering system is less than 1.5 pounds. It will also ensure that the RC car will turn left and right. This analysis utilizes double shear analysis. The equation for σavg = F/2πr2 with F being assumed to be 15 lbs. and σ = 32000 psi which is the maximum shear stress of 2011 T-3 aluminum. Using the previous values and equation, the minimum diameter is found to be 0.018 inches. Applying a safety factor of 5, the new diameter is 0.09 inches. Rounding to the next nearest practical number, the value for this diameter becomes 0.25 inches. This value will be documented as the diameter of the kingpin located in Drawing MDM_20-007.
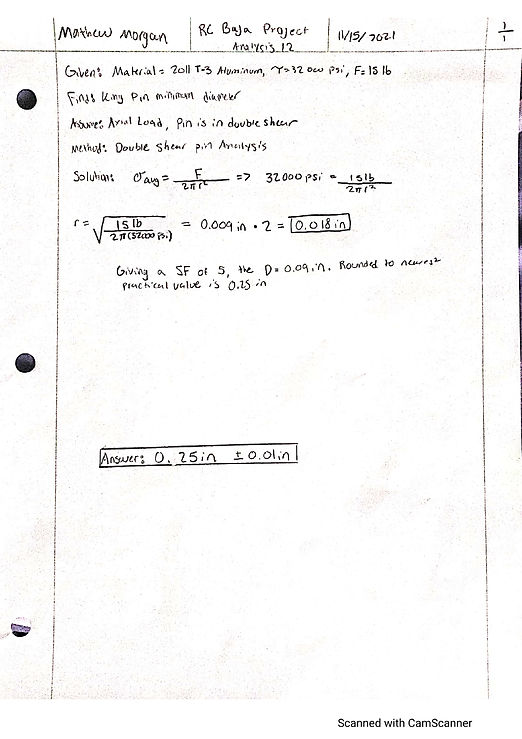
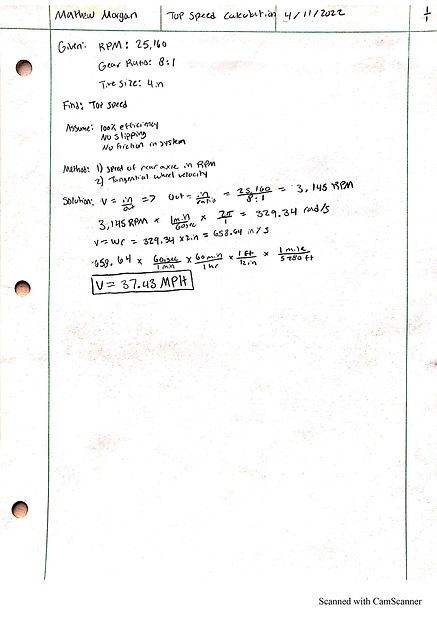
Figure 12- Kingpin Shear Analysis
Analysis 13
Analysis 13 was used to determine the top speed of the RC Baja car. This analysis was used to support the top speed test conducted during spring quarter. It was also used to ensure the design parameter of a top speed of 20 MPH is met. This analysis utilizes the RPM of the motor, the train value ratio of the drivetrain, and the diameter of the wheels. Taking the RPM and dividing it by the gear ratio, the RPM at the rear wheels is found. This equation computes a value of 3,145 RPM. Using the previous value, the rear wheel RPM is then converted into rad/s. This value comes to 329.34 rad/s. This value is then multiplied by 2 inches which is the radius of the rear wheels. This product is the linear speed of the RC car. This calculates to 658.64 in/s. Through some conversions, a linear speed in MPH is found. This value is 37.43 MPH for a top speed of the RC Baja car. This value will be documented as the calculated top speed value located in Appendix G1 of the engineering report.
Figure 13- Top Speed Analysis
Analysis 14
Analysis 14 was used to determine the rear yawing angle of the RC Baja car. This analysis was used to support the cornering test conducted during spring quarter. It was also used to ensure the design parameter of the rear yawing angle of 10-degrees or less is met. This analysis utilizes the cornering stiffness of the rear tires, velocity of the RC Baja car, radius of the turn being done, and the weight of the rear of the RC car. Taking the equation β= (αrear/µrear)(V2/gR) where αrear is the weight of the rear, µrear is the cornering stiffness ratio, V is for the velocity, g is gravity, and R is the radius of the turn. Using this equation, this calculates to approximately 60-degrees. This value will be documented as the calculated yawing angle located in Appendix G2 of the engineering report.

Figure 14- Yawing Angle Analysis
Analysis 15
Analysis 15 was used to determine the deflection of the tie rods on the RC Baja car. This analysis was used to support the collision and drop tests conducted during spring quarter. It was also used to ensure the design parameter of the tie rods deflection of 0.125 inches or less when loaded with 5 pounds is met. This analysis utilizes the force of 5 pounds, length of the tie rods, modulus of elasticity of the material, and the moment of inertia for the cross-sectional geometry of the tie rods. Taking the equation v= PL3/3EI where P is the force, L is the length, E is for the modulus of elasticity, and I is the moment of inertia. Using this equation, the deflection calculates to 0.317 inches. This value will be documented as the calculated deflection value located in Appendix G3 and G4 of the egineering report.
Figure 15- Tie Rod Deflection Analysis